Read and Concatenate Prices of Constituents of a Stock Index
Pairs trading aims to select good performing pairs from a set of universe of a stock index. It is, therefore, a starting point of pairs trading backtest to collect daily stock prices of a given stock index.
Sometimes there are symbols from which price information rea not available. In this case, we should check the all components of the stock index. In case of Nasdaq 100, recent information can be found at
https://www.slickcharts.com/nasdaq100
R code
The following R code retreives historical daily prices of constituents of the Nasdaq 100 index given all symbols of it as of 2022-07-29.
1 2 3 4 5 6 7 8 9 10 11 12 13 14 15 16 17 18 19 20 21 22 23 24 25 26 27 28 29 30 31 32 33 34 35 36 37 38 39 40 41 42 43 44 45 46 47 48 49 50 51 52 53 54 55 56 57 58 59 60 61 62 63 64 | #========================================================# # Quantitative Financial Econometrics & Derivatives # ML/DL using R, Python, Tensorflow by Sang-Heon Lee # # https://shleeai.blogspot.com #--------------------------------------------------------# # load prices of constituents of a stock index #========================================================# graphics.off(); rm(list = ls()) library(quantmod) #------------------------------------------------- # Components of the Nasdaq 100, as of 2022-07-29 #------------------------------------------------- vstr_nasdaq100 <- "AAPL,MSFT,AMZN,TSLA,GOOG,GOOGL,NVDA,META,PEP,COST, AVGO,CMCSA,ADBE,CSCO,TMUS,QCOM,INTC,TXN,AMD,AMGN, HON,INTU,NFLX,PYPL,ADP,SBUX,AMAT,MDLZ,ADI,ISRG, CHTR,GILD,BKNG,VRTX,CSX,MU,FISV,LRCX,REGN,MNA, ATVI,SNPS,KLAC,KDP,MNST,MAR,AEP,CDNS,PANW,NXPI, ASML,FTNT,ORLY,PAYX,MRVL,KHC,ADSK,EXC,CTAS,ABNB, MELI,AZN,XEL,CRWD,EA,MCHP,CTSH,LULU,DLTR,WBA, DXCM,ILMN,SGEN,IDXX,JD,BIIB,ODFL,PCAR,LCID,BIDU, WDAY,CPRT,VRSK,TEAM,ROST,FAST,ZM,DDOG,EBAY,SIRI, PDD,ANSS,ZS,ALGN,MTCH,VRSN,CEG,NTES,SWKS,SPLK, OKTA,DOCU" #------------------------------------------- # split symbols and make vector #------------------------------------------- nasdaq100_symbols <- gsub(" ", "", strsplit(vstr_nasdaq100, "\\s*,\\s*")[[1]]) nasdaq100_symbols #------------------------------------------- # read price information of constituents #------------------------------------------- sdate <- as.Date("2020-07-01") edate <- as.Date("2022-06-30") getSymbols(nasdaq100_symbols,from=sdate,to=edate) #------------------------------------------- # collect only adjusted prices #------------------------------------------- price <- NULL for(i in 1:length(nasdaq100_symbols)) { eval(parse(text=paste0( "price <- cbind(price,", nasdaq100_symbols[i],"[,6])"))) } # modify column name as only symbol colnames(price) <- gsub(".Adjusted", "", colnames(price)) #------------------------------------------- # print price time series of Components #------------------------------------------- head(price) tail(price) | cs |
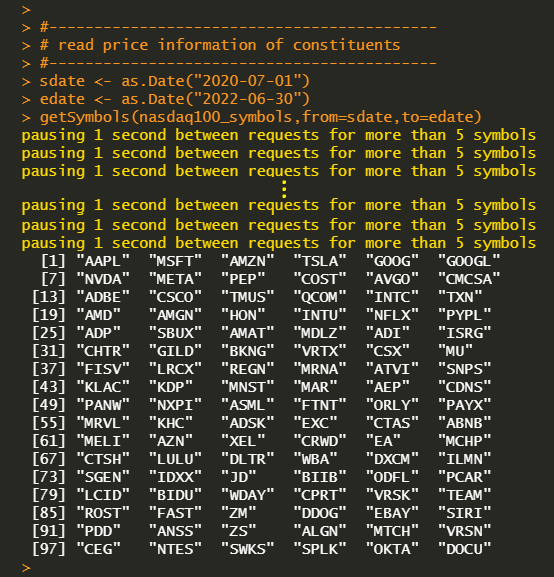
Running the above R code displays the status of data reading process as follows.
Finally, we can get the collection of individual stock prices, which are components of the Nasdaq 100 index


No comments:
Post a Comment