Run Excel Solver multiple times using VBA macro
Sequential Nelson-Siegel Yield Curve Fittings
We use Excel solver to get solutions of non-linear least squares problems. I take also Nelson-Siegel model as an example. The following spreadsheet contains monthly yield curves (left block) so that we try to estimate monthly Nelson-Siegel parameters (middle block) and get fitted yield curves (right block).

As can be seen in the figure below, monthly term structure of yields are fitted with initial guesses for parameters. we need to estimate these 4 Nelson-Siegel parameters (b0, b1, b2, lambda) period by period.
Some Excel Formula
There are three block of Excel formula like the previous post: RMSE (column P), b0+b1 (column U), fitted yields (column from V to AI). For instance, I present their Excel formula for the first row.
RMSE (column P) are a set of square root of mean of fitting errors. Curly braces denotes CTRL+SHIFT+ENTER as you already know.
|
cell P4 ⇒ {=SQRT(AVERAGE((B4:O4-V4:AI4)^2))} |
b0+b1 (column U) are sums of b0 and b1, which means a short-term rate is not negative although this is not the case for some European country. It depends on which country's yield curve is used.
| cell U4 ⇒ =Q4+R4 |
Nelson-Siegel fitted yields (column from V to AI) have their excel formula as follows.
|
cell V4 ⇒ =Q4+R4*(1-EXP(-T4*V3))/(T4*V3)+S4*((1-EXP(-T4*V3))/(T4*V3)-EXP(-T4*V3)) ... cell AI4 ⇒ =Q4+R4*(1-EXP(-T4*AI3))/(T4*AI3)+S4*((1-EXP(-T4*AI3))/(T4*AI3)-EXP(-T4*AI3)) |
Objective, Parameters, Constraints
In this Nelson-Siegel fitting problem, an objective function is RMSE and parameters are b0, b1, b2 and lambda with some constraints : b0 > 0, b0+b1>0, 0.01 < lambda < 0.1. For instance, I present their Excel formula for the first row.
| range | description |
|---|---|
| P4 | objective function value |
| Q4:T4 | parameters to be found |
| U4 | combined constraints |
Excel VBA macro code
Excel VBA code below implements the above explanations. This macro function is linked to a button you place it on the spreadsheet. As can be seen in the code below, core optimization block is the same as the previous post except for-loop iteration for monthly calculations.
In particular, (long) integer sr(=3+i) is used to indicate a proper row number to access the corresponding yield data, RMSE, parameters, restriction, and fitted yield curve.
1 2 3 4 5 6 7 8 9 10 11 12 13 14 15 16 17 18 19 20 21 22 23 24 25 26 27 28 29 30 31 32 33 34 35 | Sub run_solver_ns_multiple() Dim i As Long, sr As Long For i = 1 To 12 sr = 3 + i ' clear and start SolverReset ' uncheck Non-negative option SolverOptions AssumeNonNeg:=False ' objective and parameters SolverOk SetCell:="$P$" & sr, MaxMinVal:=2, ValueOf:="0", _ ByChange:="$Q$" & sr & ":$T$" & sr ' b0 >=0 SolverAdd CellRef:="$Q$" & sr, Relation:=3, FormulaText:="0.000000001" ' b0+b1 >=0 SolverAdd CellRef:="$U$" & sr, Relation:=3, FormulaText:="0.000000001" ' 0.01 < lambda < 0.1 SolverAdd CellRef:="$T$" & sr, Relation:=3, FormulaText:="0.01" SolverAdd CellRef:="$T$" & sr, Relation:=1, FormulaText:="0.1" ' run SolverSolve True Next i End Sub | cs |
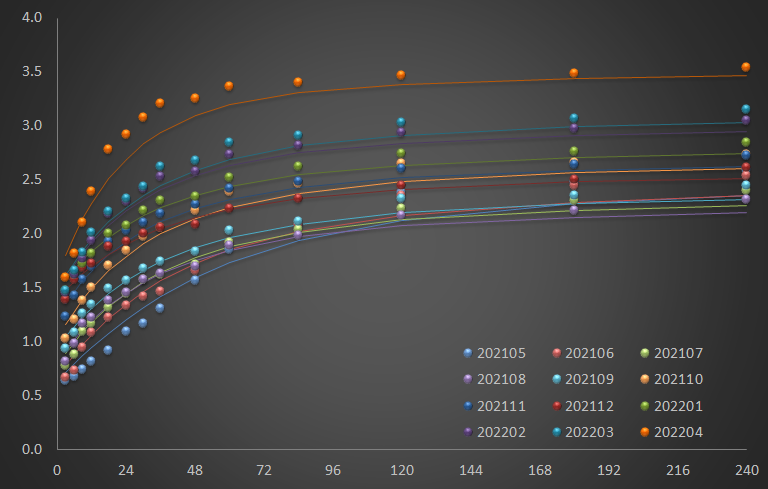
Running this macro by clicking button estimates monthly parameters of Nelson-Siegel model period by period and generate fitted yield curves as follows.

Concluding Remarks
In this post we use VBA macro to run the Excel solver multiple times. This will be useful for some repeated optimization works such as daily, weekly, or monthly yield curve estimations and so on. \(\blacksquare\)
No comments:
Post a Comment