
Running a Python script in Excel using xlwings
In this post, I show how to run a python function in Excel in terms of time series modeling perspective.
Once we know how to handle input and output data in matrix format, we no longer need to think about it. We can solely focus on changing the procedures or models to be calculated or estimated in Python.
Installation of xlwings
Among several approaches, we can use xlwings package to run a Python script in Excel.
xlwings offers various features, including user-defined functions similar to Excel's. However, this post concentrates on using Python for model estimation with Excel data and viewing the results within Excel. By starting with a simple case, subsequent advanced applications become more manageable.
Before you begin this task, make sure to install xlwings and then the Excel add-in sequentially. First, install xlwings in the conda prompt:
conda install xlwings |
Second, install the xlwings add-in in the conda prompt:
xlwings addin install |
After completing the two installations correctly, you'll find an "xlwings" menu in Excel.
Python and Excel VBA codes
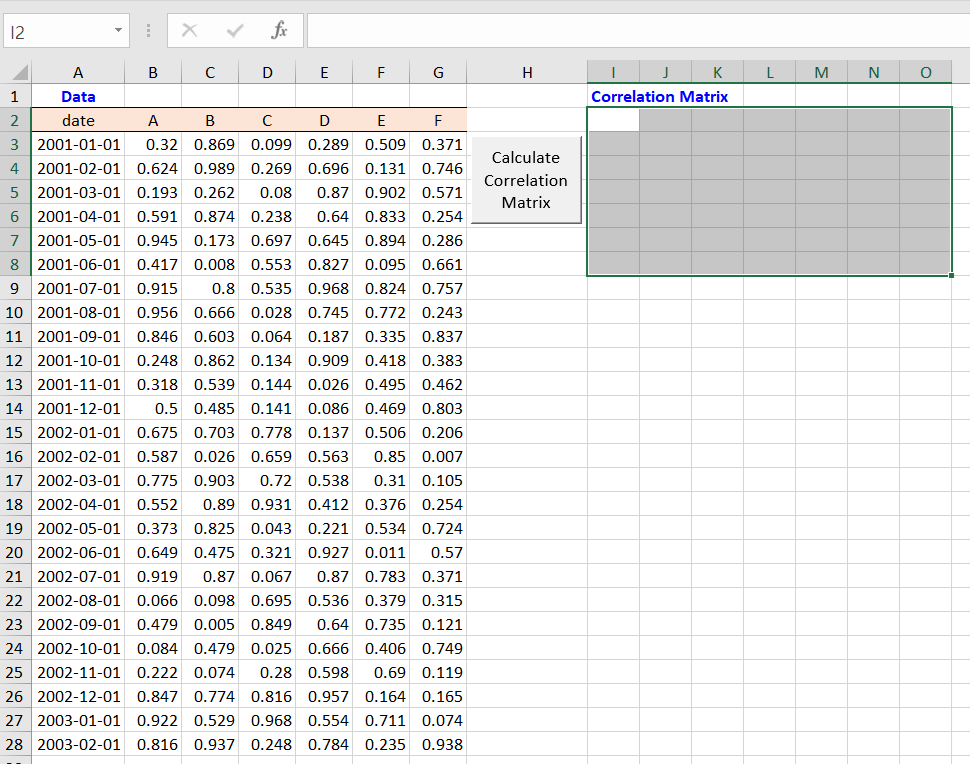
As a simple illustration, we'll utilize a correlation matrix calculation example. The corr_test.xlsm file, depicted in the figure, outlines the process straightforwardly.
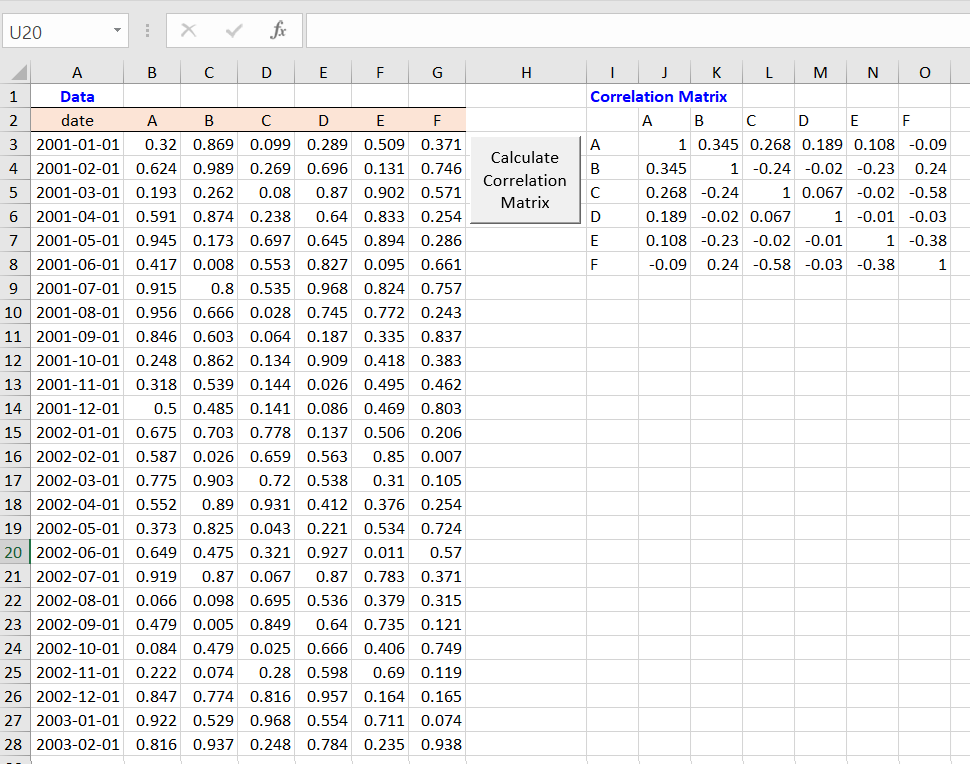
Upon clicking the calculation button, the shaded area is populated with the correlation matrix generated by executing the corr_test.py file. Here, the input data resides in the Excel file, and the output (correlation matrix) is then sent back to the Excel file.
Consequently, we have only to know how to code the corr_test.py file and the button's VBA macro.
The button for executing the Python code is linked to the following VBA macro function. This macro code simply calls the 'main()' function in the 'corr_test.py' file using "RunPython".
However, to utilize xlwings' RunPython() function in a workbook, you need to set a reference to xlwings in the VBA editor by checking the xlwings box in the VBA Editor References menu., just like when using other add-ins.
Sub btn_Click() RunPython ("import corr_test; corr_test.main()") End Sub | cs |
Python code using xlwings
As anticipated, the 'corr_test.py' file comprises three steps: 1) retrieving data from Excel, 2) computing a correlation matrix, and lastly, 3) storing the results back into Excel. With the assistance of the xlwings Python package, these tasks are simplified.
import numpy as np import xlwings as xw def main(): #---------------------------------------------- # 1. select input data sheet #---------------------------------------------- #sht = xw.Book.caller().sheets[0] # 1st sheet sht = xw.Book.caller().sheets['Sheet1'] # with name #---------------------------------------------- # 2. read input data as list #---------------------------------------------- lt_name = sht.range('B2:G2').value # column names lt_data = sht.range('B3:G28').value # data # convert data to a NumPy array np_data = np.array(lt_data) # convert names to a row and column vector np_data = np.array(lt_data) np_name_row = np.array(lt_name) np_name_col = np.array(lt_name).reshape(-1, 1) #---------------------------------------------- # 3. process #---------------------------------------------- # calculate correlation matrix np_data = np_data.astype(float) # to ensure numeric data np_corr_out = np.corrcoef(np_data, rowvar=False) #---------------------------------------------- # 4. write results to specific ranges in Excel #---------------------------------------------- sht.range('J2').value = np_name_row sht.range('J3').value = np_corr_out sht.range('I3').value = np_name_col | cs |
The processing is simple. In this case, Excel files executing VBA code are automatically detected by xlwings, so there's no need for separate specification.
In the main() function, it first selects Sheet1 and then reads the data. Next, it calculates the correlation matrix using the np.corrcoef() function. Finally, it sends the final result back to Excel.
Now that we've learned how to extract data from Excel and store results back into Excel, the remaining step is to tailor the 'process' section to suit your analysis objectives.
No comments:
Post a Comment